Re-Designing Visualisations for a Mobile Health Tracking App
Redesign visualisations to support patients throughout the breath sampling process.
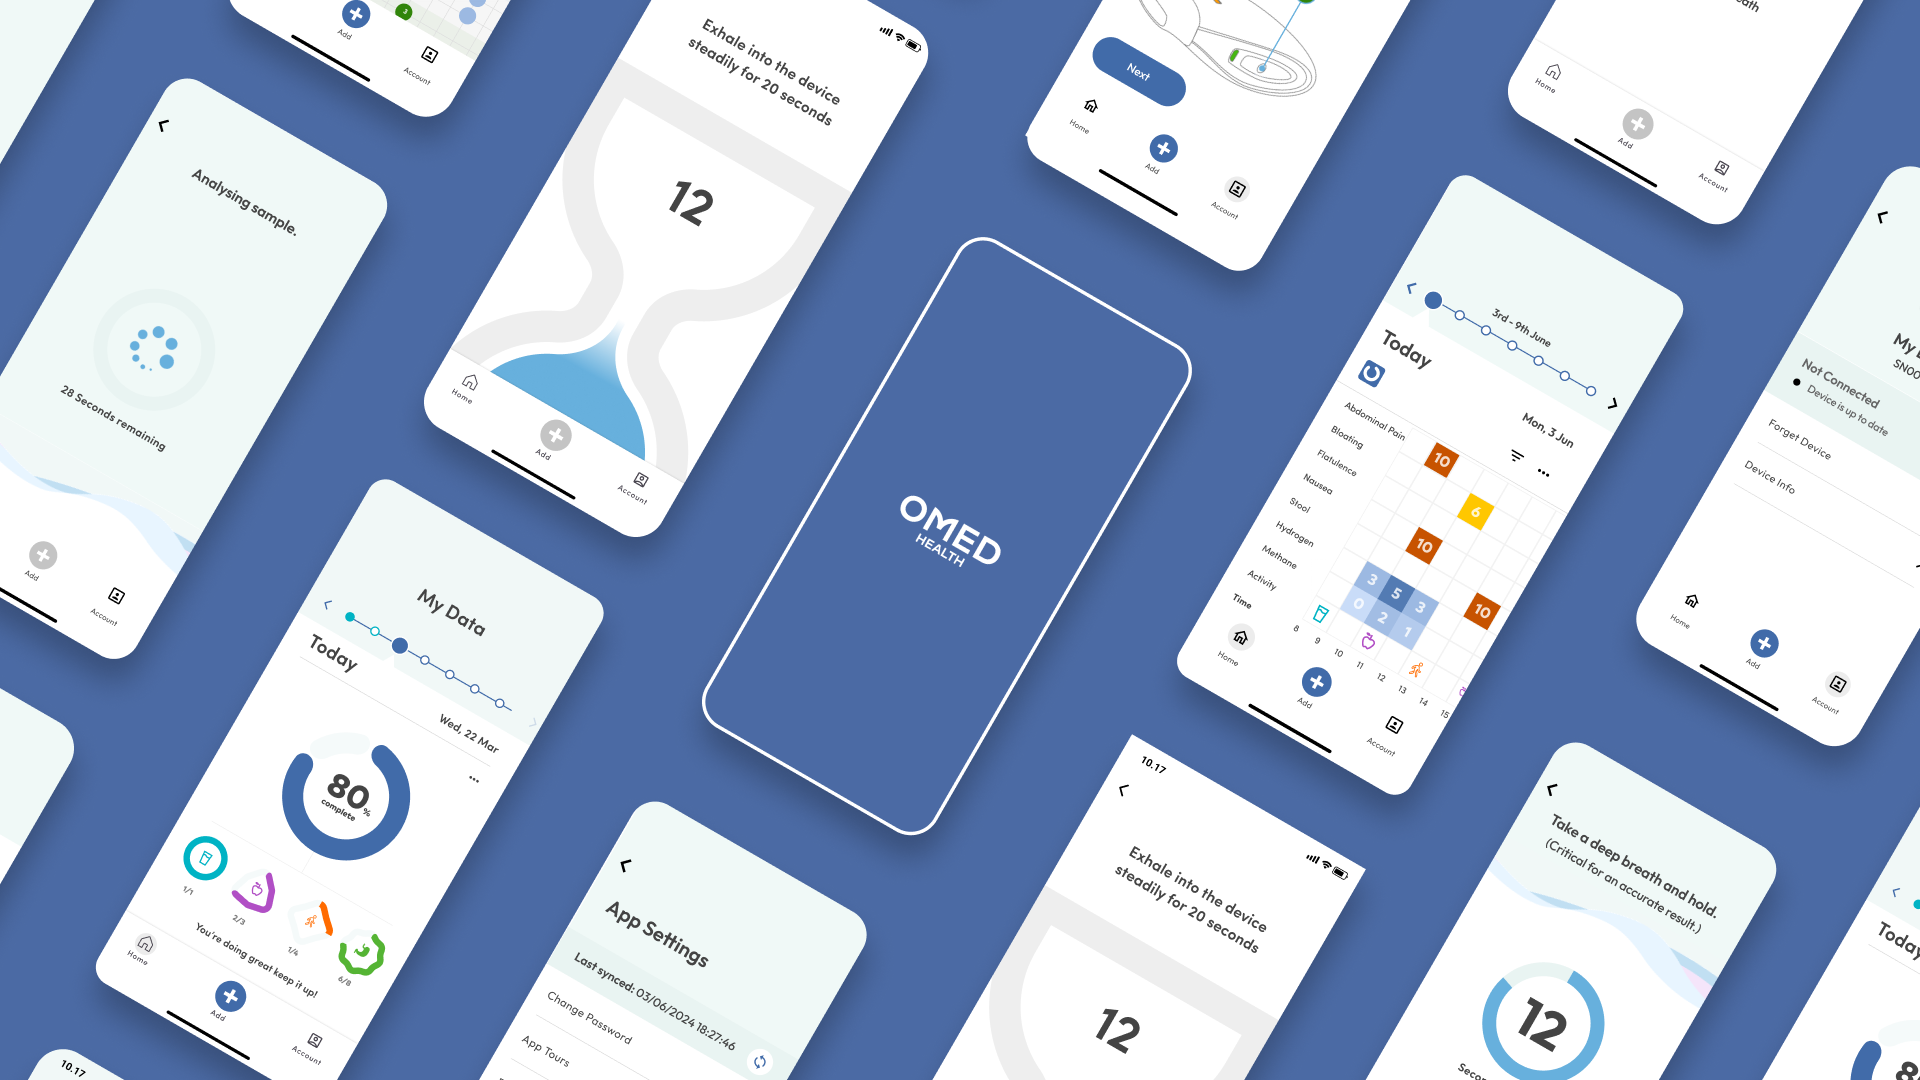
The App
The OMED Health app is an app for Android and iOS that allows users to track gastrointestinal symptoms, food intake, pair their OMED breath device, log breath tests and share data with their clinicians and receive clinician's diagnoses and treatment plans.
The Redesign Project
The product owner had identified that users struggled to correctly interpret the existing visualisations and found them unhelpful. Given my background in data visualisation, I was asked to improve them.
My Contributions
Data Entry Progress Tracker
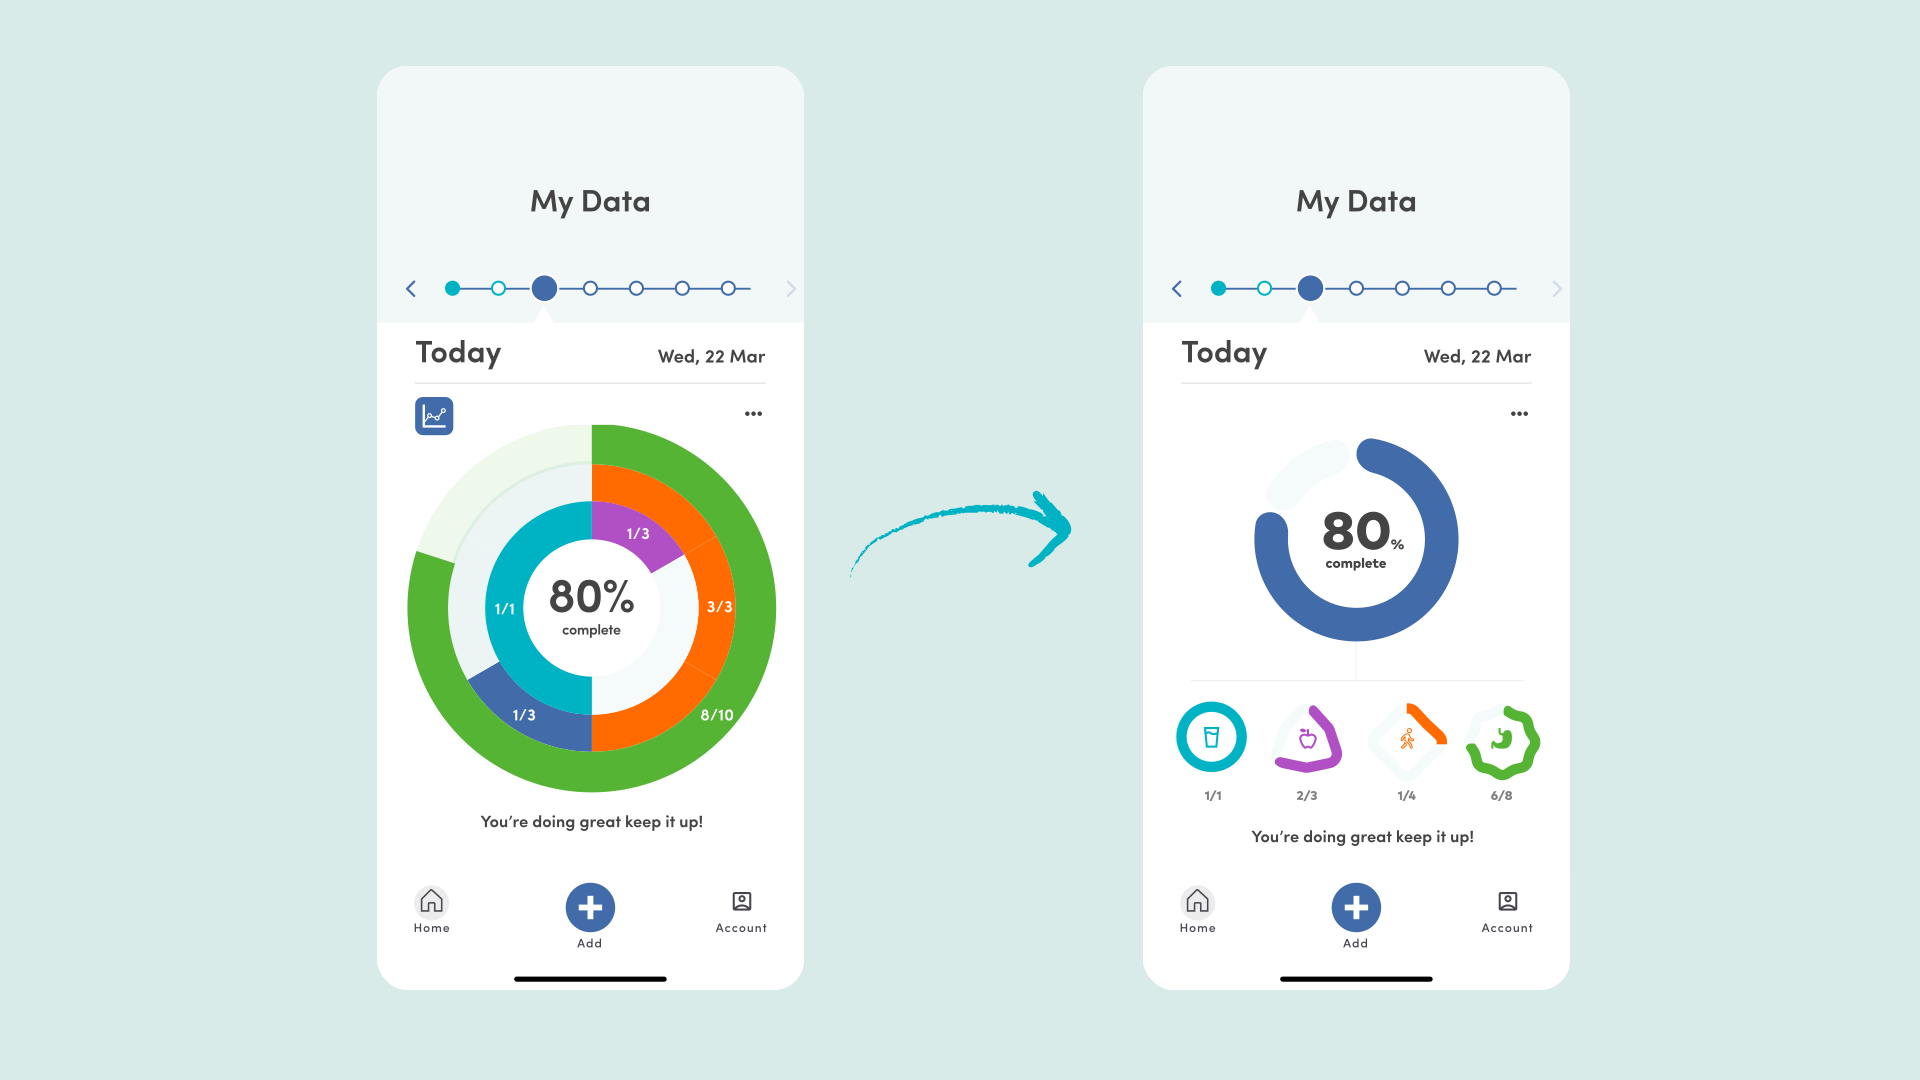
I was tasked with re-designing the in-app data visualisations. I focused on reducing cognitive load and making the design more modular. The main donut chart displays the overall score which is an aggregation of the bottom donut charts. By placing the smaller charts in a row, we use either a horizontally-scrolling list, wrap the charts onto multiple rows or simply scale them if new charts have to be added. The previous design was lacking context for what each bar mean with users either having to remember the colour mapping or tap on each segment to identify it, the redesign used consistent coloured icons, which were used throughout the application.
Symptom Correlation Matrix
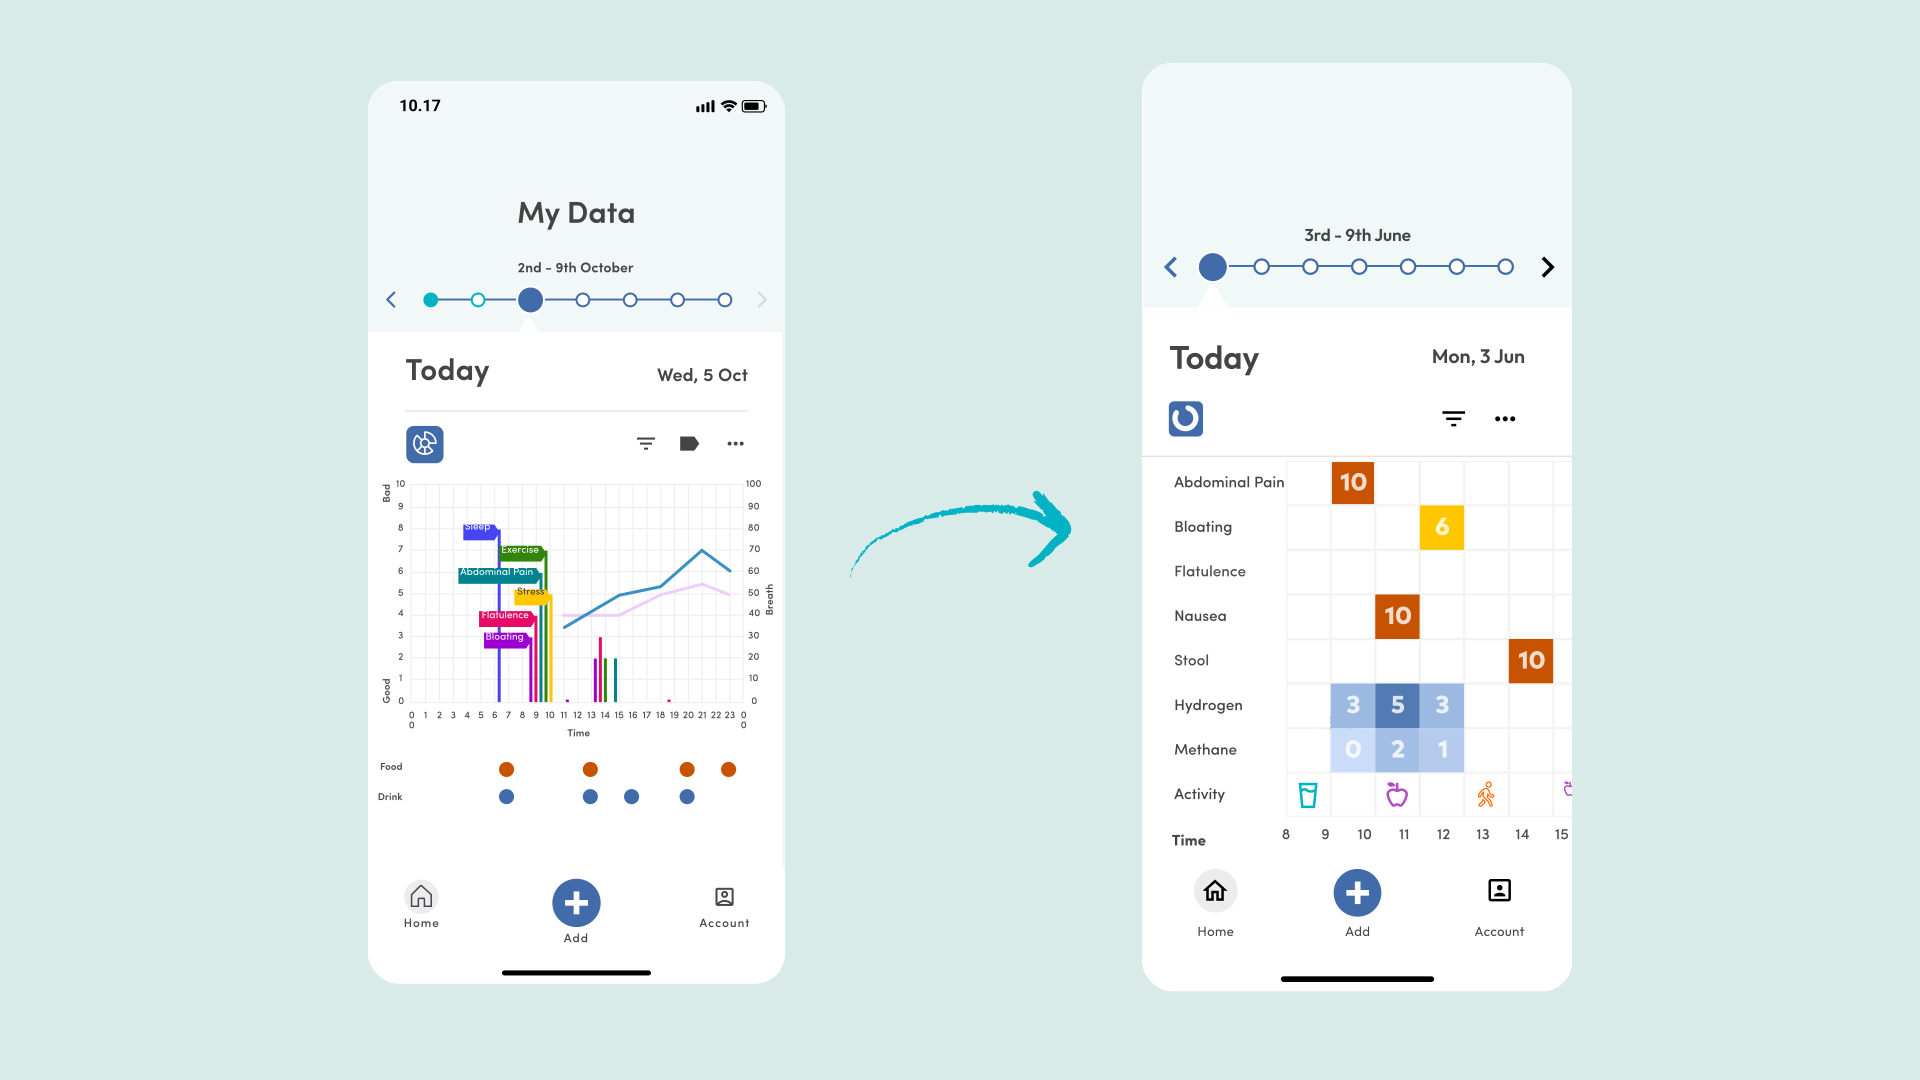
I also designed a visualisation to record multi-series data. The task was to display:
- sparse symptom severity of 5 different symptoms
- hydrogen and methane levels
- entries for food, drink and exercise all of which were to be displayed to show changes across a 24 hour period. The original design used a heavily stacked bar chart, but due to the sparsity of the data, the bars were impractically thin. My design was inspired by a heatmap with labelled rows for every series (symptoms, hydrogen, methane, food, drink and exercise), time of the x-axis and each cell was coloured by the severity of the symptom or level of compound. Food, drink and exercise markers simply indicated the presence of a record and a tooltip displayed the specific content. Overall, while the redesign was better, I would argue the attempt to cross-correlate so many different series on a single mobile screen was flawed.
Summary
I worked alongside clinicians and the Product Owner to design and prototype app screens and user flows, focussing particularly on the data visualisations. I built interactive prototypes in Figma to test user flows and gather feedback.
You can find more of my UI work on my Figma Community profile.